Reliability Tests
The Slap Verification system biometric engine has been tested using three Neurotechnology internal datasets, captured with different devices. All datasets contained biometric data belonging to the same persons, so one dataset could be used as a gallery, and another as a probe. These datasets were used:
- Dataset 1 – four-finger slaps from both left and right hands, captured in a contactless way with Google Puxel 4a (5G) smartphone camera as photos.
- Dataset 2 – left hand four-finger slaps, captured in a contact way with several different fingerprint readers and saved as images
- Dataset 3 – right hand four-finger slaps, captured in a contact way with several different fingerprint readers and saved as images
Four experiments were performed during rhe testing:
- Experiment 1 – all slaps from the Dataset 1 were compared between each other.
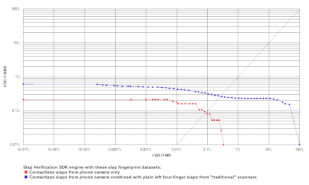
- Experiment 2 – the Dataset 1 was used as probe, and the Dataset 2 was used as gallery.
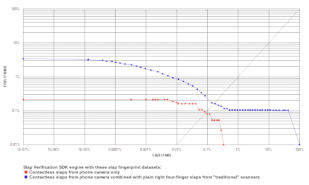
- Experiment 3 – the Dataset 1 was used as probe, and the Dataset 3 was used as gallery.
- Experiment 4 – the Dataset 1 was used as probe, and both Dataset 2 and Dataset 3 were used as gallery.
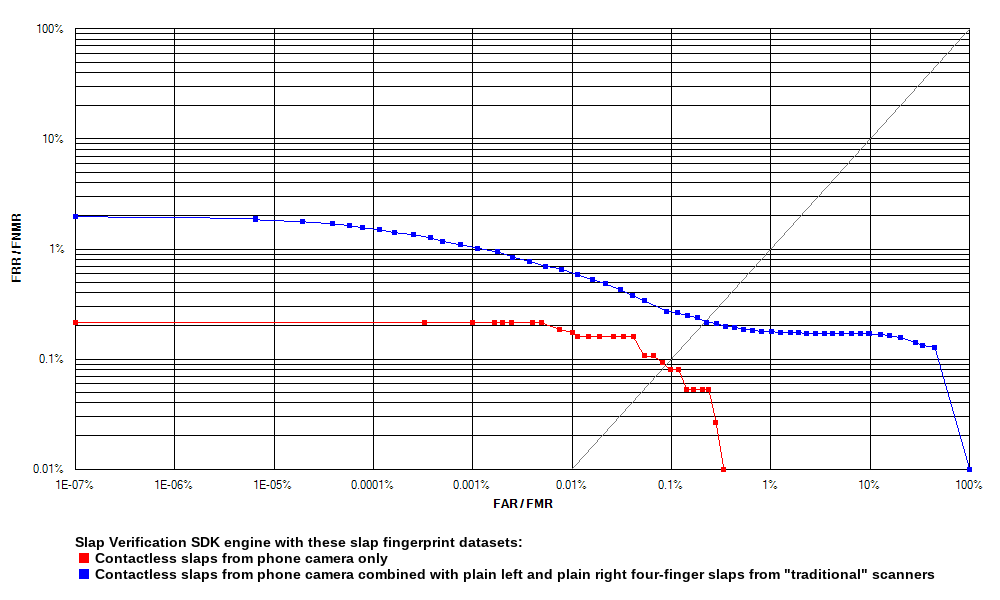
Receiver operation characteristic (ROC) curves are usually used to demonstrate the recognition quality of an algorithm. ROC curves show the dependence of false rejection rate (FRR) on the false acceptance rate (FAR). The charts below compare the Experiment 1 results with the results of other experiments.
Experiment 1 vs. Experiment 2
Experiment 1 vs. Experiment 3
Experiment 1 vs. Experiment 4
| Slap Verification 2024.2 engine reliability tests | ||||||
|---|---|---|---|---|---|---|
| Experiment 1 | Experiment 2 | Experiment 3 | Experiment 4 | |||
| Genuine pairs | 7,506 | 26,859 | 24,469 | 51,328 | ||
| Impostor pairs | 607,934 | 7,732,866 | 7,732,116 | 15,464,982 | ||
| EER | 0.0869 % | 0.2496 % | 0.1548 % | 0.2095 % | ||
| FRR at 1 % FAR | 0.0000 % | 0.2346 % | 0.1063 % | 0.1773 % | ||
| FRR at 0.1 % FAR | 0.0799 % | 0.3314 % | 0.2738 % | 0.2728 % | ||
| FRR at 0.01 % FAR | 0.1865 % | 0.4431 % | 0.9359 % | 0.6566 % | ||